Andon
A machine-sound anomaly detector that learns only from healthy recordings, and turns a green, yellow or red light when a machine starts to sound wrong.
92.13%AUC on held-out test recordings, scored once, where 50% is a coin flip. The challenge’s own baseline scores 79.70%.
3 of 3real fans stopped by the Pico 2 by itself, 3.461–11.661 s after a fault (one trial per fan).
- Status
- In progress since October 2026. The software is done, and on a Raspberry Pi Pico 2 it now hears a fault in a real fan and cuts the fan’s power by itself.
- Role
- Solo project. I designed and built all of it.
- Code
- Andon on GitHub
Why it exists
Factories use andon lights to flag a problem on the line. But machine faults are rare and expensive to record, so the system has to learn from normal sound alone.
A small convolutional neural network (CNN), a common kind of model for images and sound, learns to recognize each individual machine by its sound. When it can no longer tell which machine it’s hearing, something has changed.
From a sound to a light
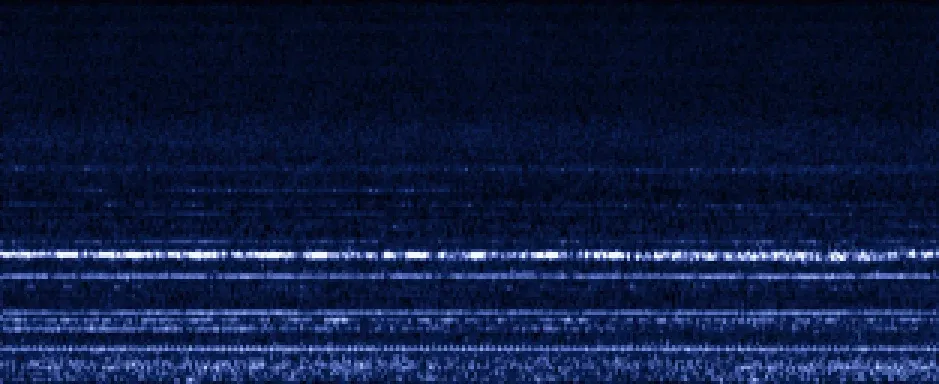
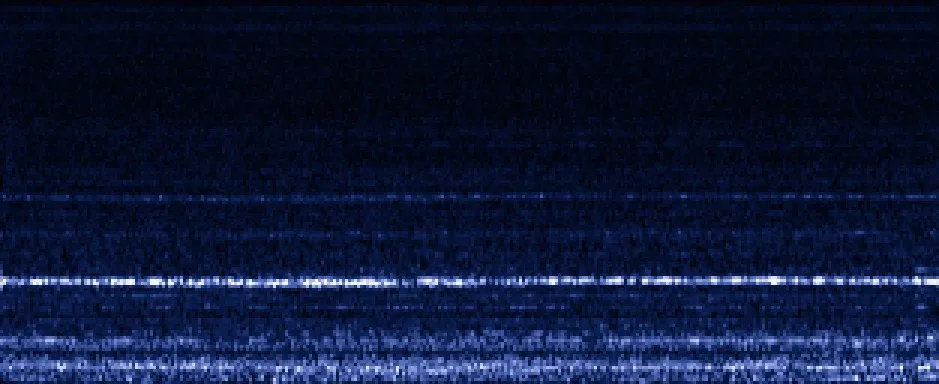
Listen. Each 10-second clip becomes a log-mel spectrogram: how loud each of 128 frequency bands is, every 32 ms.
Recognize. One small CNN per machine type learns to tell that type’s machines apart, from normal recordings only.
Score. If the CNN can’t recognize the machine it’s hearing, the score rises. Each 2-second window gets a score, every second.
Set limits. Normal audio sets a warning limit and a control limit for each machine, like a factory control chart (the mean of normal scores plus 2 and 3 standard deviations). They’re the two dashed lines in the replay.
Light. Two windows in a row over the warning limit turn it yellow. Three in a row over the control limit turn it red, and it stays red until someone resets it.
The data and the model
- Where the sound came from
- DCASE 2020 Task 2 is the machine-sound part of a public audio challenge (Detection and Classification of Acoustic Scenes and Events). It’s built from two public datasets: ToyADMOS (toy cars and conveyors) and MIMII (real fans, pumps, slide rails and valves). The dataset authors recorded the machines and made the faults on purpose, for example with damaged parts, leaks, blockages or imbalance. Background noise recorded in real factories was mixed in, so the clips sound like a factory floor. The data is shared under CC BY-NC-SA 4.0. The real-fan recordings are my own, described under Hardware.
- How it’s split
- Training uses only normal clips. The development test set mixes normal and faulty clips, and it’s where every choice was made. The evaluation set is other machines of the same types: the model learns their normal sound, but their test clips were scored once, at the end, so it’s the fairer test. There’s no separate validation set for the CNN. It trains for a fixed 100 epochs and keeps the last one.
- What kind of model it is
- It isn’t regression, and it isn’t a hand-tuned filter. A fixed front end turns sound into 128 frequency bands every 32 ms. A CNN then learns, from those bands, to name which machine it’s hearing.
- What it outputs
- A score, not a yes or no: how unsure the model is that it’s hearing the right machine. The light makes the yes or no from that score, using the control-chart limits and the 2-in-a-row and 3-in-a-row rules above.
Better than the DCASE baseline on five of six machine types
AUC is the chance a random faulty clip scores as more abnormal than a random normal one. 50% is guessing. The baseline is the official model released with the challenge, an autoencoder: it learns to rebuild normal sound and flags sound it can’t rebuild well. I re-implemented it and scored it the same way as my model.
Show as a table
| Machine type | Andon’s CNN | DCASE baseline |
|---|---|---|
| ToyCar | 90.29 | 79.65 |
| ToyConveyor | 80.38 | 88.31 |
| fan | 94.47 | 86.10 |
| pump | 94.73 | 84.51 |
| slider | 98.25 | 81.73 |
| valve | 94.64 | 57.93 |
| Mean of six | 92.13 | 79.70 |
92.13 ± 0.16% mean AUC on the held-out evaluation set, against 79.70 ± 0.39% for the DCASE baseline, scored the same way. The mean is over 3 training runs, each started from a different random seed.
Before changing anything I reproduced the published baseline on the development set, to within 0.88 AUC points on all six machine types.
Loudness alone isn’t enough on the benchmark. A sound-level meter for each machine averages 63.34% AUC on the development set, against 83.25 ± 0.22% for a Gaussian mixture for each machine and 86.64 ± 0.57% for my CNN. It’s near chance on toy cars (50.98%), toy conveyors (48.66%) and valves (54.28%).
Played back as a continuous stream of test audio, the light caught 65.57% of 30-second faults, on average 10.57 s after they started, with 5.53 false alarms per hour.
It has about 98k weights. Stored as 8-bit integers (int8), it’s 98.7 KB, down from 383.0 KB, and still scores 92.08% AUC. That’s small enough to fit on a microcontroller.
The trained checkpoints are public, and two commands in the README re-check the held-out CNN AUC results from a fresh clone.
What was hard
There were no faults to train on
Instead of learning what a fault sounds like, the CNN learns to name which machine it hears. Low confidence in the right name becomes the anomaly score. On the evaluation set, valve went from 57.93% AUC with the baseline to 94.64%.
Overconfidence hurt the score
Without mixup, the ToyConveyor classifier hit 100% training accuracy, which likely left little room for a fault to lower its confidence. Blending pairs of training examples (mixup) raised mean development AUC from 84.33% to 86.64%.
PyTorch doesn’t say how it rounds
Its quantized kernels don’t specify their rounding, and a C port has to match them exactly. So I wrote a NumPy fixed-point reference of about 400 lines that defines every integer step, and exports test vectors the C version must match.
The hardware so far
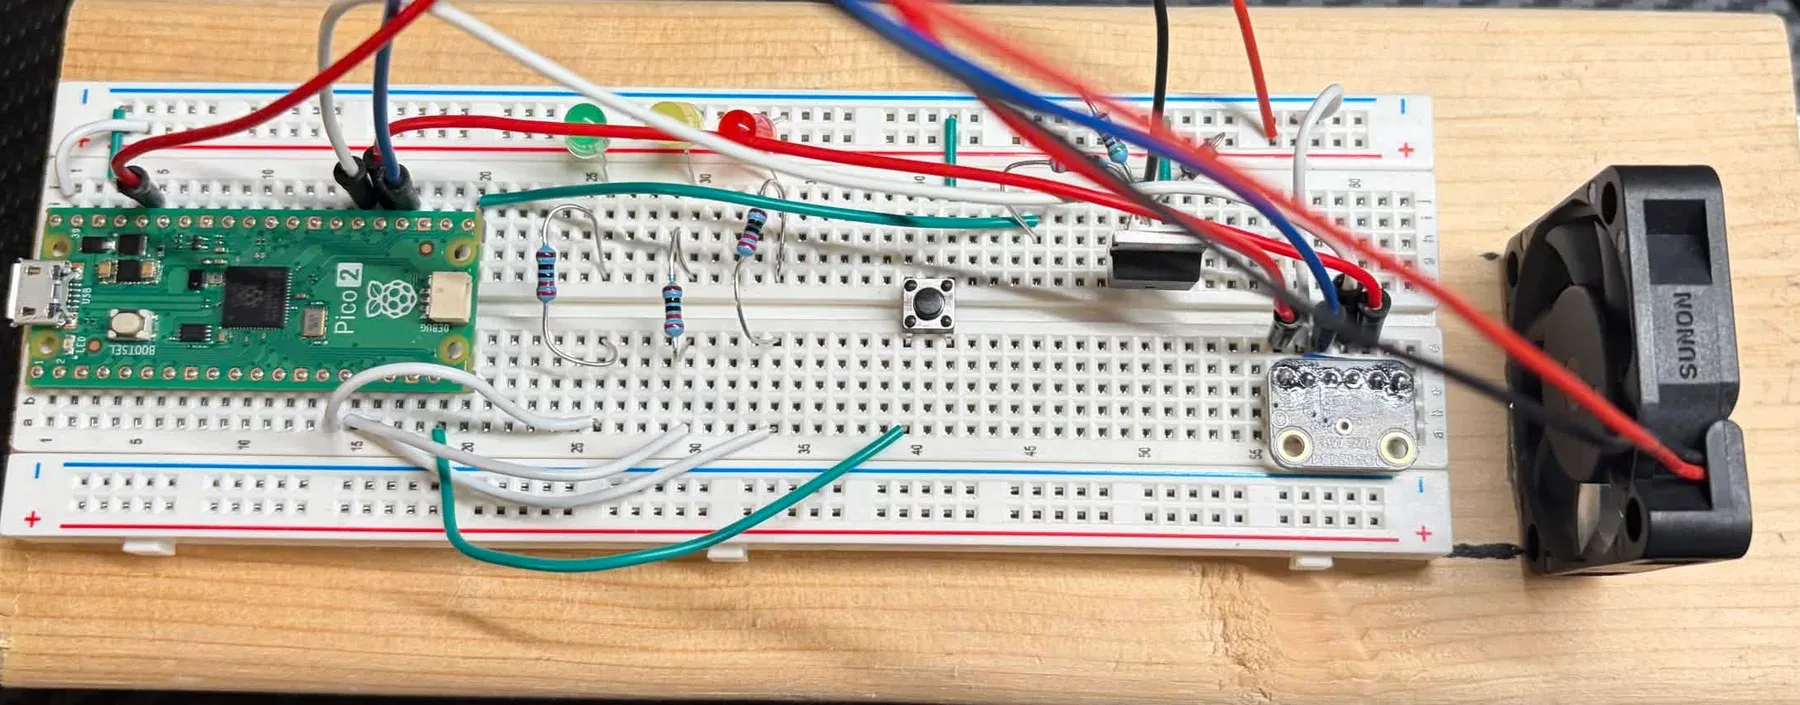
The board now does the whole job by itself: it listens to a real fan, scores the sound, and cuts the fan’s power when the sound goes wrong. So far that’s been tried once on each fan.
- Andon light
- Real green, yellow and red LEDs and a reset button on the Pico 2. The detector’s scores drive the light. Red cuts the fan, and only the button clears it.
- Kill switch
- A MOSFET cuts the fan’s power, and the blades coast to a stop. On the board, 40 of 40 fan-off trials passed. The worst PC round trip, from sending the command to the Pico’s reply, was 3.35 ms against a 100 ms limit.
- Microphone
- A digital microphone read by the Pico. A 1 kHz test tone measured 1000.02 Hz.
The real-fan recordings
The first session was recorded at home. A model can learn the room instead of the fault: the background, the desk and the echoes. So every session used for training or evaluation is now recorded in one room, the one where the device will be calibrated and demonstrated. The home session is kept on disk, but it’s never used for training or scoring.
There are three sessions, each on a different day: d1 and d2 for development, where I make every choice, and d3, held back and scored once at the end. In each session, every one of the 3 fans gets about 33 min of normal running (198 clips of 10 s) and 3 min of each of 2 faults (18 clips each), recorded in takes: one unbroken recording of one fan in one condition. The normal running includes a control take: the fan is taken off its mount, put back and recorded running normally, so that just handling the fan isn’t mistaken for a fault.
- Faults
- Underspeed isn’t a change to the fan. It’s a speed setting. The fan’s power is switched on and off 25,000 times a second (pulse-width modulation, or PWM), and for underspeed it’s on 85% of the time instead of all of it, so the fan runs slower, like a worn motor or a weak power supply. The fan takes a while to slow down, so the first 30 s of each underspeed recording is never used. Obstruction is a card strip over the bottom third of the intake. A third fault, a piece of tape on one blade, was dropped during d1 because it changed the sound by a different amount each time.
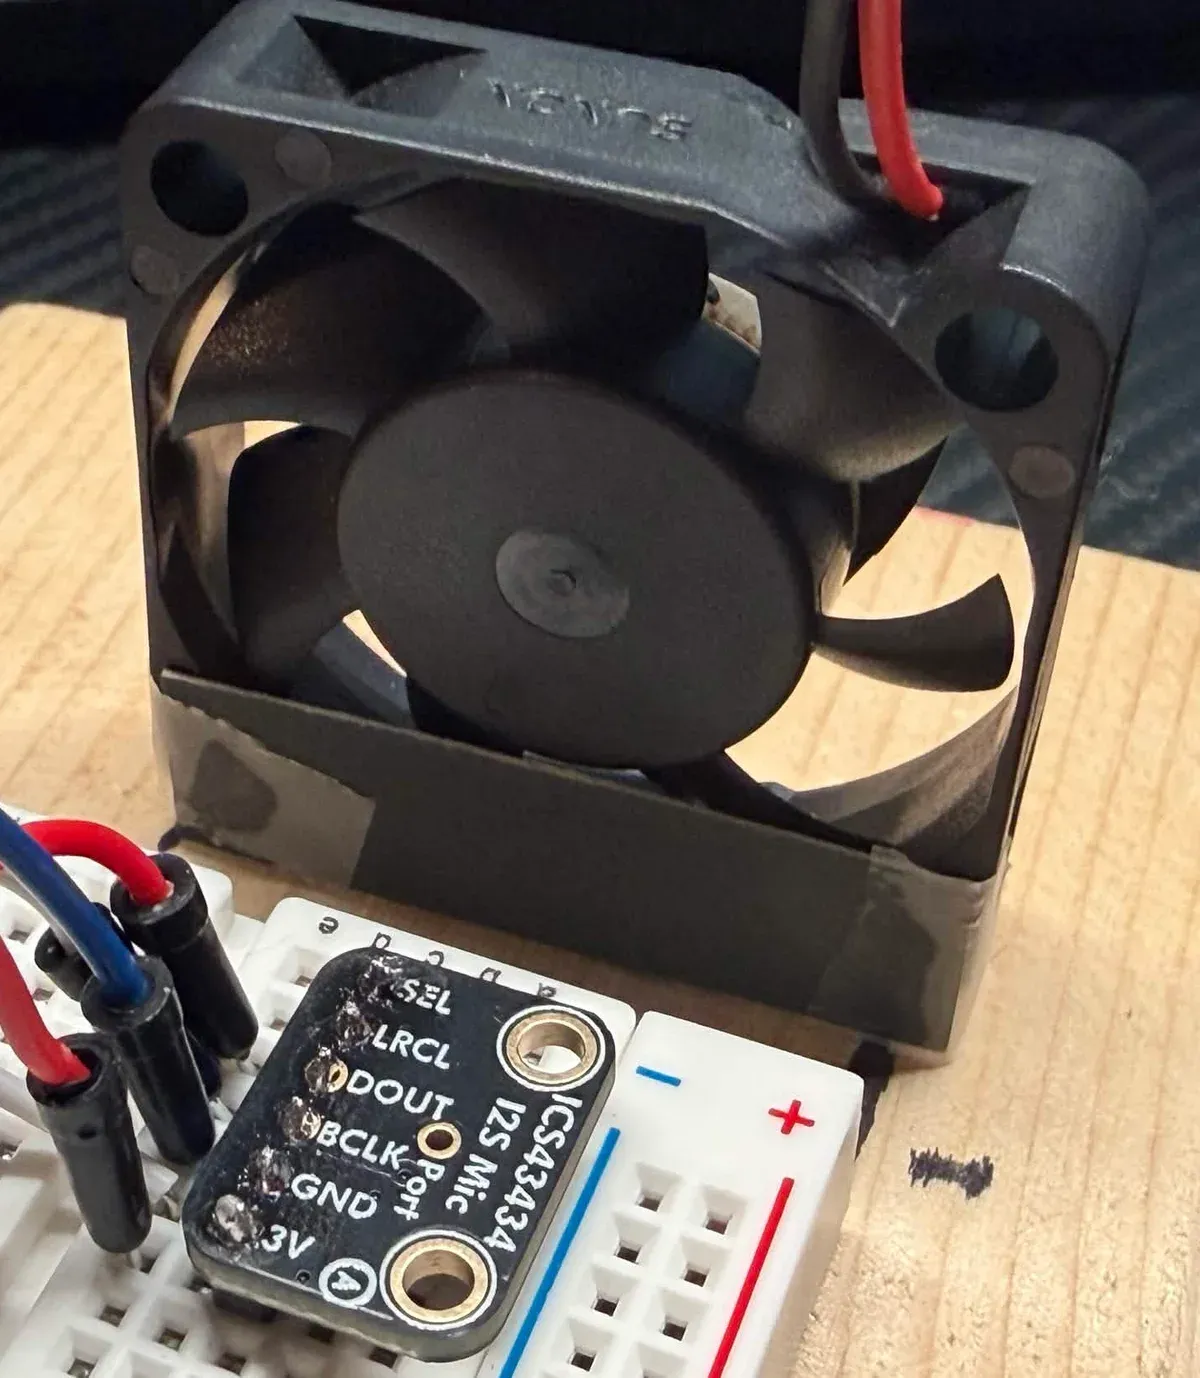
All three sessions reached the PC with no breaks and no missing or corrupt audio, and a repeat check showed the underspeed fault changing the Sunon fan’s sound by a similar amount on each day.
Recording details: audio frames per session, the repeat check, and how much each fault changes the sound
- d1, Nov 16, 2026
- 14 takes. The Pico sent 461,322 numbered, checked audio frames to the PC over USB (Universal Serial Bus), with 0 breaks, 0 missing and 0 corrupt. One normal clip is left out, because of a knock, not the fan.
- d2, Nov 17, 2026
- 12 takes. The Pico sent 438,813 numbered, checked audio frames to the PC over USB (Universal Serial Bus), with 0 breaks, 0 missing and 0 corrupt. No clips were left out.
- d3, Nov 18, 2026
- 13 takes. The Pico sent 450,068 numbered, checked audio frames to the PC over USB (Universal Serial Bus), with 0 breaks, 0 missing and 0 corrupt. One take was saved under the wrong fan’s name, so it’s left out whole and was recorded again. Two normal clips are left out because of a door thud, not the fan.
- Repeat check
- Before d2, I set a limit for the Sunon’s underspeed: in its most-changed band (4000–8000 Hz), each later session had to land within ±3 dB of d1. It was −14.2 dB in d1, −11.9 dB in d2 (+2.3 dB) and −13.7 dB in d3 (+0.4 dB), both inside the limit.
| Fan | Underspeed | Obstruction |
|---|---|---|
| Sunon | −14.2 / −11.9 dB (4000–8000 Hz) | +14.0 / +13.7 dB (500–1000 Hz / 250–500 Hz) |
| ANVISION A | −8.8 / −8.3 dB (2000–4000 Hz) | +10.8 / +11.9 dB (500–1000 Hz) |
| ANVISION B | −9.7 / −8.4 dB (2000–4000 Hz) | +8.8 / +9.3 dB (500–1000 Hz) |
A model for the real fans
The CNN from the first stage didn’t carry over. On the development sessions it rated the fault as more normal than normal running in two of the six fan-and-fault cases. So the real fans use a simpler model, chosen on d1 and d2 by a rule I wrote down before any run.
- Where the sound came from
- The three sessions above, which I recorded through the Pico’s microphone in one room, with that room’s own background noise.
- How it’s split
- The model learns each fan’s normal sound from d1 and d2 only, and never hears a fault while it learns. d3 was scored once, at the end. As on the device, the light’s limits come from the first 10 minutes of the tested session’s normal running, and the light is judged on the rest.
- What kind of model it is
- A Gaussian mixture model for each fan: a statistical description of that fan’s normal sound, fitted to the average of the 128 frequency bands over each 2-second window. It isn’t a CNN, regression or a hand-tuned filter.
- What it outputs
- A score for each window: how unlikely its sound is for that fan when it runs normally. The light turns the scores into green, yellow or red with the same control-chart rules as above, and red cuts the fan.
On d3 it separated the faults from normal running in all six fan-and-fault cases: 100% AUC. With the light, 6 of 6 fault recordings went red, with 0 false reds in about an hour of normal running.
A plain sound-level meter also gets 100% on these two faults, because underspeed makes a fan quieter and the card makes it louder. So I checked whether the model hears more than volume, on the development sessions only: every test recording was set to the fan’s normal volume, which leaves a level meter nothing to go on. The model still caught every fault, 100.00 ± 0.00% AUC on every fan and fault, so it hears the shape of the sound, not just how loud it is. That doesn’t show yet that it would catch a fault that’s quiet in real life.
Fast enough on the board
The microphone delivers sound in 32 ms frames, so the work for each frame has to finish before the next one arrives. My budget is under 20 ms per frame. The real fans’ Gaussian mixture runs in C on the Pico 2 (its RP2350 chip at 150 MHz, one of its two cores): turning the sound into frequency bands and scoring each window takes 1.684 ms per frame. Fed recorded audio of each fan, the board’s scores match Python’s to a relative error of 2.51e-06, and the three fans’ models take 402,480 B of flash.
The benchmark’s int8 CNN also fits, at 10.82 ms per frame, and matches Python bit for bit on the board.
Stopping the fan by itself
After a 5-second hold-off, the board fits each fan’s limits on its first 10 minutes of running, then watches. In each trial, a minute into the watch, a serial command switched the fan from full speed to 85% (underspeed). Nothing else was sent and no button was pressed: the board went red on its own scores and cut the fan’s power.
| Fan | Switch to power cut |
|---|---|
| Sunon (id_00) | 11.661 s |
| ANVISION A (id_01) | 3.471 s |
| ANVISION B (id_02) | 3.461 s |
Where it still falls short
AUC isn’t real-world performance. 92.13% AUC still caught only 65.57% of faults on a continuous stream of test audio, and 21.75% for valve. 5.53 false alarms per hour is too many for a real line. A much simpler Gaussian mixture model, a classic statistical method, beats the CNN on 3 of 6 machine types.
On the real fans, both faults also change the loudness, so they’re easy faults. The same-volume check used the development sessions only, and it doesn’t show the model would catch a fault that’s quiet in real life. The board has stopped each fan only once so far, and its false-stop rate hasn’t been measured yet.
What’s next
Measuring how reliably the board stops the fan.
An hour of normal running to count false stops, then 10 trials of each fault and a demo video. The tape-on-a-blade imbalance fault, dropped from the dataset because it wasn’t consistent, comes back as an unseen test fault: judged against a control take and at matched volume, and reported on its own. The obstruction card can only be fitted with the fan off, so those trials fit the card, then start the fan, are timed from the fan starting, and are reported separately.